Economic Affairs, Vol. 65, No. 1, pp. 69-76, March 2020
DOI: 10.30954/0424-2513.1.2020.10
©2020 EA. All rights reserved
Marketing Analysis of Marigold in Jammu Subtropics of Jammu and Kashmir
Manpreet Kaur1, Anil Bhat2*, S.P. Singh2, Rakesh Sharma2 and Lalit M Gupta2
1Ph.D, Scholar, CCS Haryana Agricultural University, Hisar, Haryana, India
2Sher-e-Kashmir University of Agricultural Sciences and Technology of Jammu, J–K, India
*Corresponding author: drbhatanil@gmail.com ( ORCID ID: 0000-0002-4806-9467)
Received: 28-08-2019
Revised: 16-01-2020
Accepted: 29-02-2020
ABSTRACT
An economic analysis of marketing was done in Jammu region to analyze the efficiency of exchange of flowers from production to consumption side. Primary data were collected from farmers selected through multistage sampling technique and wholesalers and retailers selected randomly from subtropical area of Jammu and Kathua districts in 2017-18. Five marketing channels were found in the study area which were farmer-retailer-consumer, farmer-wholesaler-retailer-consumer, farmer- retailer (pre harvest contract)-consumer, farmer-retailer (farm marketing)-consumer, farmer-consumer in which first 3 were followed by farmers of Jammu district and all 5 were followed in Kathua district. In Jammu district, the most efficient marketing channel was channel III followed by I and II while in Kathua district, channel V was found most efficient followed by channel IV, III, I and II. Major marketing constraints faced by farmers were distant markets followed by lack of regulated markets, lack of market information and high transportation cost.
Highlights
 Marketing of marigold flowers is beneficial to the farmers as they are receiving a net return of ₹ 31.78/ kg with a minimum of ‘ 20.30/kg to a maximum of ₹ 52.60/kg. The direct marketing channel was most efficient while the one involving both wholesalers and retailers was least efficient. The wholesalers and retailers were earning an average marketing margin of ₹ 8.22/kg and ₹ 16.69/kg respectively.
Keywords: Marketing, marigold, efficiency, pre harvest contract, farm marketing
Floriculture is one among the most promising sector of the horticulture. India ranks second in flower cultivation next to China. India’s present share in the global floricultural export market is negligible (0.61%) as compared to the Netherlands (58%), Columbia (14%), Equador (7%), Kenya (5%), Israel (2%), Italy (2%), Spain (2%) and others (10%) (Anonymous, 2015a). In 2013-14, India has a total area of 255020 ha under total flower cultivation with an annual production of 1754500 MT loose flowers and 47942 lakh cut flowers. Tamil Nadu, Karnataka, West Bengal, Maharashtra, Andhra Pradesh and Gujarat are the major flower producing states having 1,21,150 ha area that accounts for nearly half of the India’s total area under floriculture (Anonymous, 2015b). India has exported 22,518.58 MT of floriculture products to the world for the worth of ₹ 479.42 crores in 2015-16 (APEDA, 2017). Marigold is grown over an area of 53530 ha with a total production of 497720 MT loose flowers and 765000 numbers of cut flowers (Anonymous, 2015b). Marigold is regularly exported to Mexico, Peru, USA, Japan, Spain, Romania, Netherlands, Turkey, Poland, Italy, Australia, Canada, Africa etc. (Chaurasia, 2013). In Jammu and Kashmir, flowers are grown over an area of 750 ha in 2013-14 (Anonymous, 2015b). Out of which marigold crop ranked first among all flowers with maximum area of 530 ha under cultivation followed by gladiolus, rose, tulip, chrysanthemum etc. (Anonymous, 2015b). In Jammu province, a total of 468.53 ha area is under flower cultivation with a total production of 13680 MT loose flowers and 10.01 lakh number of cut flowers in 2014-15. Out of which, marigold flowers were grown over an area of 467.33 ha with a total production of 13680 MT (Anonymous, 2016b). Jammu subtropics have suitable agro climatic conditions for production of marigold. Jammu district has the highest area (289.36 ha) under marigold production followed by Kathua (65.00 ha), Reasi (54.05 ha) and Samba (30.65 ha). The production of marigold follows the same order like the trend of area as 6960 MT in Jammu, 1560 MT in Kathua, 1300 MT in Reasi and 730 MT in Samba (Anonymous, 2016).
How to cite this article: Kaur, M., Bhat, A., Singh, S.P., Sharma, R. and Gupta, L.M. (2020). Marketing analysis of marigold in Jammu subtropics of Jammu and Kashmir. Economic Affairs, 65(1): 69-76.
Methodology
The present study was conducted in Jammu and Kathua districts of Jammu & Kashmir purposively during 2017-18 as the selected districts were having highest area, 289.36 ha and 65 ha respectively under marigold flower crops during the year 2014-15. Five villages were selected from each district on the basis of highest number of marigold farmers, so as to constitute a total of 10 villages and ten farmers each were selected randomly from the selected villages to make a sample size of 100 farmers in all for carrying out the study. Flower markets of the sampled area were selected purposively to collect information related to marketing, arrivals and prices of marigold flower crop. 5 wholesalers from flower market of Jammu and 5 retailers from each of the district were selected for collecting information regarding marketing.
Analysis of Marketing
Net Farmers Price: The net price received by the farmer has been estimated as the difference in gross price received and sum of marketing costs and value loss during harvesting, grading, transport and marketing.
Where NPF is net price received by the farmers (₹/kg),
GPF is gross price received by the farmers or wholesale price to farmers (₹/kg),
CF is the cost incurred by the farmers during marketing (₹/kg),
LF is physical loss in produce from harvest till it reaches assembly market (per Kg or %).
Marketing Margins: The margins of market intermediaries included profit and returns, which accrued to them for storage, the interest on capital and establishment after adjusting for the marketing loss due to handling.
Intermediaries Margin =
Gross price (sale price) - Price paid (cost price) - Cost of marketing - Loss in value during wholesaling
Net marketing margin of the wholesaler is given mathematically by,
Where, MMw is net margin of the wholesaler ₹/kg),
GPw is wholesaler’s gross price to retailers or purchase price of retailer ( ₹/kg)
Cw is cost incurred by the wholesalers during marketing (₹/kg),
Lw is physical loss in the produce at the wholesale level (per kg)
In the marketing chain, when more than one wholesaler is involved, i.e., primary wholesaler, secondary wholesaler, etc, then the total margin of the wholesaler is the sum of the margins of all whoelsaers. Mathematically,

Where MMwi is the marketing margin of the i-th wholesaler.
Net marketing margin of retailer is given by:
Where, MMR is net margin of the retailer (₹/kg),
GPR is price at the retail market or purchase price of the consumers (₹/kg)
LR is physical loss in the produce at the retail level (per kg),
CR is the cost incurred by the retailers during marketing (₹/kg).
The first bracketed term in equations (1), (2) and (3) indicates the gross return, while the second and third bracketed terms indicate respectively the cost and loss at different stages of marketing.
Thus, the total marketing margin of the market intermediaries (MM) is calculated as,
Similarly, the total marketing cost (MC) incurred by the producer/ seller and by various intermediaries is calculated as
Total loss in the value of produce due to injury/ damage caused during handling of produce from the point of harvest till it reaches the consumers is estimated as
Marketing Efficiency: Acharya’s modified marketing efficiency formula (Acharya and Agarwal, 2001) is used for calculating marketing efficiency.

Where NPF is net price received by the farmers (₹/ kg),
MM is the marketing margin,
MC is marketing cost,
ML is marketing loss.
Problems and constraints: The producers were facing numerous constraints in production and marketing of marigold. Thus, to analyze whether they are similar or dissimilar between different categories of farmers, chi square test was performed according to the following formula:
Where, Oi = Observed frequency of problems Ei = Expected frequency of problems.
RESULTS AND DISCUSSION
Marketing channels are the path followed for movement of the produce from point of production to point of consumption. The different marketing channels were operating in the study area and these are given as under:
Marketing channels followed by farmers of Jammu district:
(i) Producer- Retailer-Consumer
(ii) Producer-Wholesaler-Retailer-Consumer
(iii) Producer-Retailer*-Consumer
Marketing channels followed by farmers of Kathua district:
(i) Producer- Retailer-Consumer
(ii) Producer-Wholesaler-Retailer-Consumer
(iii) Producer-Retailer*-Consumer
(iv) Producer-Retailer**-Consumer
(v) Producer-Consumer
*Retailing through pre harvest contract ** Retailing through farm marketing
*Retailing through pre harvest contract ** Retailing through farm marketing
Fig. 1 : Flow chart of various marketing channels of the study area
The quantity of marigold sold through the different marketing channels is given in table 1. The table revealed that the quantity sold through channel I, II and III in Jammu district was worked out to be 1253q, 445q and 180q, respectively and in Kathua district, the quantity sold through channel I, II, III, IV and V was worked out to be 678q, 436q, 127q, 90q and 120q, respectively
Table 1: Disposal of flowers through different channels in quintals (q)
Figures in parenthesis indicates percentage of total.
The channel wise decomposition of marketing costs components for marigold in Jammu district is given in Table 2. These costs varied to the extent of ₹ 6.50, ₹ 5.50 and ₹ 5.50 per kg for channel I, II and III, respectively. It was further observed from the table that labour charges accounted for the maximum share in marketing cost i.e., 46.15 per cent, 54.55 and 54.55 per cent of total marketing cost in channel I, II and III, respectively. Apart from that, transportation charges also made a considerable share in the marketing cost i.e., 46.15 per cent, 36.36 per cent and 36.36 per cent in channel I, II and III, respectively. Marketing cost borne by wholesaler in channel II was ₹ 2.50/kg in which the labour charges accounted for 80 per cent of total marketing cost. The shop and rehri charges accounted for the maximum share in the marketing cost of the retailer i.e., 80 per cent, 45.45 per cent and 83.33 per cent in channel I, II and III, respectively.
The channel wise decomposition of marketing costs components for marigold in Kathua district is given in Table 3 and they varied to the extent of ₹ 6.50, ₹ 5.50 and ₹ 8.50 and ₹ 12.00 per kg for channel I, II and III, and V, respectively. It was further observed from the table that labour charges accounted for the maximum share in marketing cost in channel I and channel III i.e., 52.63 per cent and 55.56 per cent, respectively while in channel II, transportation cost accounted for the maximum share, i.e. 64.52 per cent. In channel IV, as the produce is marketed through farm marketing, no marketing cost was incurred by the producer while in channel V, labour charges and transportation cost accounted for equal share in the marketing cost, i.e. 45.45 per cent. Marketing cost borne by wholesaler in channel II was ₹ 2.50/ kg in which the labour charges accounted for 80 per cent of total marketing cost. The shop and rehri charges accounted for the maximum share in the marketing cost of the retailer i.e., 80 per cent, 71.43 per cent and 80.00 per cent in channel I, II and III, respectively whereas in channel IV, transportation cost accounted for maximum share in marketing cost, i.e. 62.50 per cent.
Table 2: Channel wise decomposition of marketing cost components for marigold flowers in Jammu district (₹/kg)
Figures in parenthesis indicates percentage of total,
Price spread and marketing margin
As shown in table 4, the marigold growers of Jammu district received the net price of about ₹ 22.70/kg, ₹ 20.30/kg and ₹ 24.10/kg which were 37.83 per cent, 33.83 per cent and 40.17 per cent of the price paid by the consumer for channel I, II and III, respectively. The producers’ sale price of
Table 3: Channel wise decomposition of marketing cost components for marigold flowers in Kathua district (`/kg)
Figures in parenthesis indicates percentage of total.
Table 4: Price spread of marigold flowers under different marketing channels in Jammu district (₹/kg)
Figures in parenthesis indicates percentage of total.
marigold was ₹ 32.00/kg in channel I while it was ₹ 28.00/kg in channel II and ₹ 35.00/kg in channel III. The table further revealed that the per kg marketing cost incurred by the farmer was 6.50/kg in channel I followed by channel II (₹ 5.50/kg) and channel III (₹ 5.50/kg) which accounted for 10.83 per cent in channel I followed by channel II (9.17%) and channel III (9.17%). The marketing cost borne by the wholesaler was 4.17 per cent of the consumer rupee and his margin was about 13.70 per cent.
The marketing loss incurred by the wholesaler was ₹ 3.28/kg (5.47%). The wholesalers’ sale price to retailer was ₹ 42.00/kg. In case of retailer, marketing cost worked out to be ₹ 2.50/kg (4.17 per cent) in channel I while it was ₹ 3.50/kg (5.83%) in channel II and ₹ 3.00/kg (5.00%) in channel III. Margin of retailer was found maximum in channel I (₹ 19.65/ kg i.e. 32.75%) followed by channel III (₹ 17.49/kg i.e. 29.15 per cent) and channel II (₹ 10.46/kg i.e. 17.43 per cent).
Table 5: Price spread of marigold flowers under different marketing channels in Kathua district (`/kg)
Figures in parenthesis indicates percentage of total.
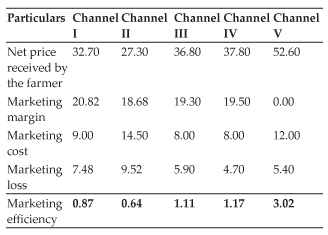
As shown in table 5, the marigold growers of Kathua district received the net price of about ₹ 32.70/kg, ₹ 27.30/kg, ₹ 36.80/kg, ₹ 37.80/kg and ₹ 52.60/kg which were 46.71 per cent, 39.00 per cent, 52.57 per cent, 54.00 per cent and 75.14 per cent of the price paid by the consumer for channel I, II, III, IV and V respectively. The producers’ sale price of marigold was ₹ 42.00/kg in channel I while it was ₹ 38.00/kg in channel II and ₹ 45.00/kg in channel III, ₹ 40.00/kg in channel IV and ₹ 70.00/kg in channel V. The table further revealed that per kg marketing cost incurred by the farmer was maximum in channel V (₹ 12.00/ kg) followed by channel II (₹ 8.50/kg), channel I (₹6.50/kg), channel III (₹ 5.50/kg) whereas in channel IV, there is no marketing cost incurred by the farmer. The marketing cost borne by the wholesaler was 3.57 per cent of the consumer rupee and his margin was about 11.74 per cent. The marketing loss incurred by the wholesaler was ₹ 3.28/kg (4.69%). The wholesalers’ sale price to retailer was ‘ 52.00/kg. In case of retailer, marketing cost worked out to be ₹ 2.50/kg (3.57 per cent) in channel I while it was ₹ 3.50/kg (5.00%) in channel II, ₹ 2.50/kg (3.57%) in channel III, ₹ 8.00/kg in channel IV and 0.00/kg in channel V. Margin of retailer was found maximum in channel I (₹ 20.82/kg i.e. 29.74%) followed by channel IV (₹ 19.50/kg i.e. 27.86 per cent), channel III (₹ 19.30/kg i.e. 27.27%) and channel II (₹ 10.46/ kg i.e. 14.94 per cent).
Marketing efficiency in different channels
The marketing efficiency of Jammu and Kathua district is shown in Table 6 and 7, respecgtively. Channel III with marketing efficiency 0.73 was found most efficient marketing channel for marigold farmers in Jammu district followed by channel I and channel II. Channel V with marketing efficiency 3.02 was found most efficient marketing channel for marigold farmers of Kathua district followed by channel IV, channel III, channel I and channel II.
Table 6: Marketing efficiency of different channels for marigold flowers in Jammu district
Table 7: Marketing efficiency of different channels for marigold flowers in Kathua district
Marketing constraints faced by the farmers
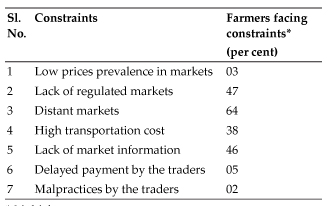
Table 8 and Fig. 2 highlight the marketing constraints prevailing in the study area. The prevalent marketing related constraints were low prices prevalence in the market, lack of regulated markets, distant markets, high transportation cost, lack of market information, delayed payment by the traders and malpractices by the traders.
Table 8: Marketing constraints faced by the farmers
* Multiple responses.
It also revealed that the most serious problems were distant markets (64%) followed by lack of regulated markets (47%), lack of market information (46%) and high transportation cost (38%).
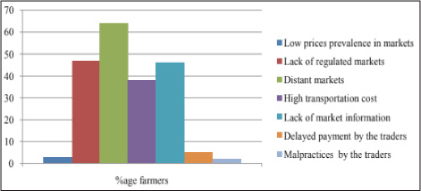
Fig. 2: Marketing constraints faced by the farmers
Table 9 compares the constraints faced by the farmers of Jammu and Kathua district.
Table 9: Comparison of marketing constraints faced by farmers of Jammu and Kathua district
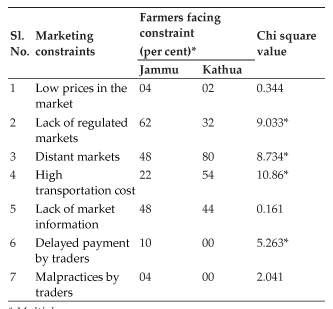
* Multiple responses.
While there was no significant differences in some problems like low prices in the market, lack of market information and malpractices by traders where farmers of both the districts are facing these problems with same severity, there were some problems where there was a significant difference between the severity like lack of regulated markets where 62 per cent farmers of Jammu and 32 per cent farmers of Kathua district felt the need, distant flower markets where only 48 per cent farmers of Jammu were facing the constraint while in Kathua district 80 per cent farmers were facing the constraint, high transportation cost where 54 per cent farmers of Jammu districts reported to face the constraint while 22 per cent farmer of Kathua were facing the constraint and delayed payment by traders where 10 per cent farmers of Jammu district were facing the constraint and no farmer of Kathua district was facing the constraint.
REFERENCES
Agricultural and Processed Food Products Export Development Authority (APEDA). 2017 www.apeda.gov.in assessed on 16.05.2017.
Anonymous, 2015b. Indiastat. www.indiastat.com/agriculture/2/whatsnew.aspx assessed on 12.05.2017.
Anonymous. 2015a. Vision 2050, Directorate of Floriculture, ICAR.
Anonymous. 2016. Directorate of Floriculture, Jammu.
Chaurasia, V. 2013. An Economic Study of Production and Marketing of Marigold Cultivation in Raipur district of Chattisgarh. M. Sc. (Ag.) thesis. Indira Gandhi Krishi Vishwavidyalaya, Raipur, India.